DATA VISUALIZATIONS
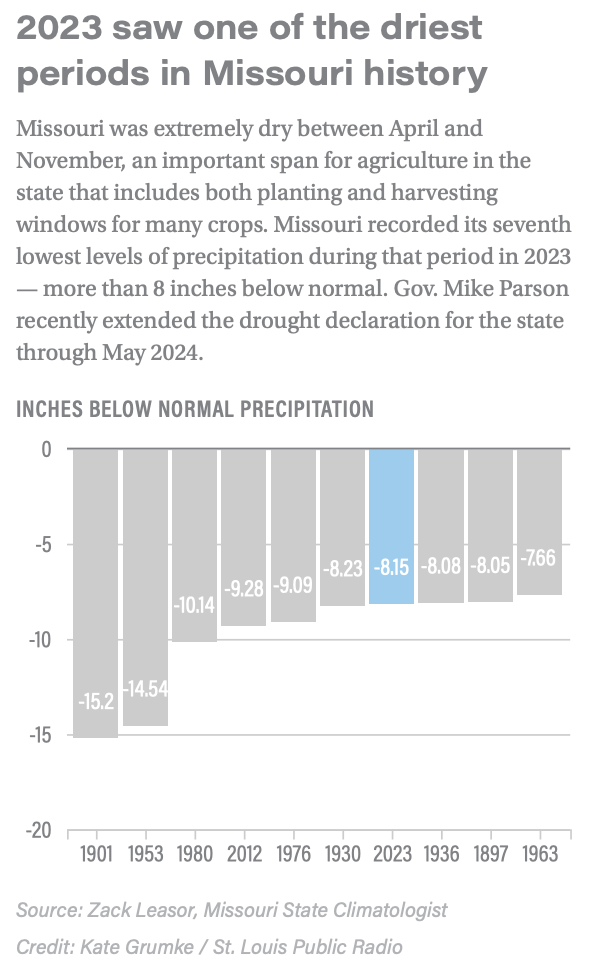
I use NPR’s dailygraphics rig to create data visualizations for my articles and for my colleagues. I also pitch in where I can, producing election night graphics and doing data analysis for reporting, mainly using python and google sheets.


